
Several days ago I was explaining structural features that were visible on the class trip to the Billy Goat Trail located in Maryland. The path the class took on the Billy Goat Trail started at the Majors Cabin and proceeded to the south, or downstream collecting data along the way. The measurements that were taken consisted of foliation, bedding, joints, fold hinges and limbs and lamprophyre dikes. Joints are especially important in order to determine whether or not our hypothesis is viable. If there is in fact no fault underneath Mather Gorge then the measurements of all the joints should be in roughly the same orientation.
 |
| Mather Gorge on the Billy Goat Trail. The yellow arrows indicate direction of travel and the yellow start denotes the starting point. |
In the picture below is a structural feature mentioned before known as jointing. By using the software and the orientation of Mather Gorge a comparison is made regarding their proclivity. As seen below the pink line represents the general trend of Mather Gorge and the blue planes represent the average strike and dip of joint measurements taken while in the field. By looking at the picture below (the one with the yellow annotations) we can determine that there is more than one set of joints or faults. It is important to note the perpendicular relationship that the joints outlined in yellow have to one another. As mentioned above if the joint sets are in different orientations there might be an area of faulting under the gorge that is responsible for its formation. Additional information is needed to confirm the hypothesis but this is a good start.
I see at least two sets that run parallel to one another, however because I was unable to climb down and observe the structures for myself I can only assume that there are only two. In the stereo-net diagram below there is more than one joint set and their relationships in regards to Mather Gorge and other joints is irregular. Again, there is insufficient evidence to deny or support our hypothesis.
 |
| Large scale joint sets on the Virginia side of the Billy Goat Trail. The yellow arrows are pointing to a set of joints parallel to one another. There is another joint set perpendicular to the longer sets, as shown by the arrows and yellow outlines. |
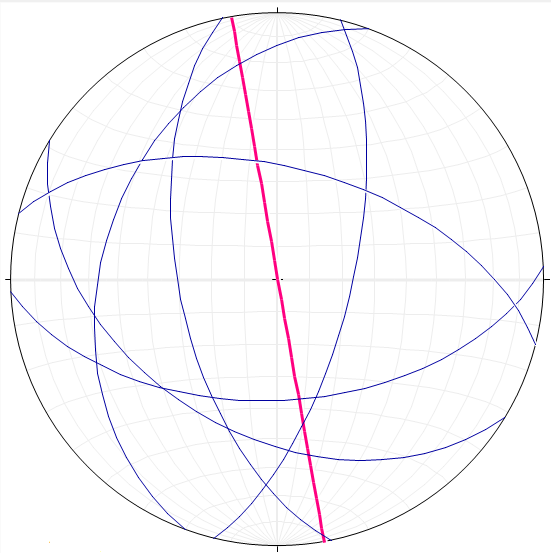 |
| Pink line represents the overall trend of Mather Gorge. The blue planes represent the average strike and dip of joints collected by the class. |
The idea here is that if the lamprophyre dikes have been offset it is most likely due to faulting underneath the gorge. It is also, however possible for the offset of the lamprophyre dikes to be due to their initial non-linear orientation and nothing to do with the presence of faults. By graphing the data sets collected from the class the orientation of the dikes can be compared with the general trend of Mather Gorge. Then we can look back at the jointing trends to see if there is any similarity as shown below. When comparing the trend of Mather Gorge to the orientation of the lamprophyre dikes they seem to be almost perpendicular to one another but this alone does not explain the gorge. When comparing the joint sets to both the trend of the gorge and the orientation of the dikes no significant relationship is observed, as seen below. There is some evidence of possible faulting running parallel to Mather Gorge, which can be seen by looking at the diagrams below, however due to data constraints I am unable to make a definitive conclusion at this time. Can the trend of the gorge be explained by some other geological mechanism?
 |
| Lamprophyre dikes - Billy Goat Trail Virginia side - picture courtesy Callan Bentley. |
 |
| The pink line represents the overall trend of Mather Gorge. The Green planes represent the orientation of the lamprophyre dikes. |
 |
| The pink line represents the overall trend of Mather Gorge. The Green planes represent the orientation of the lamprophyre dikes. The blue planes represent the average strike and dip of joints data collected. |
To answer the above mentioned question the orientation and general trend of foliation was plotted on a stereo-net via the stereo-net software. If there is another explanation for the unusually straight nature of this part of the Potomac River it might be noticeable here. Below is a stereo-net that illustrates foliation along Mather Gorge and compares it to the general trend of the gorge. There does seem to be some analogous behavior between the foliations themselves and the trend of Mather Gorge.
 |
| The pink line represents the overall trend of Mather Gorge. The orange planes represent the strike and dip of foliation observed adjacent to the gorge. |
Given the information I can not support or deny the presence of a fault or fault sets as the crux of Mather Gorge, however it is possible that faulting has assisted in its orientation. Therefore due to uncertainties the mystery of Mather Gorge prevails.
No comments:
Post a Comment